As shown in the chart below, the Australian share market has recovered to its previous high-water mark which was back in August last year. This in spite of the significant falls in January (caused by inflation fears) and in late February (caused by Putin’s invasion of Ukraine).
S&P/ASX 200 Index – 1 year movement to 24 April 2022
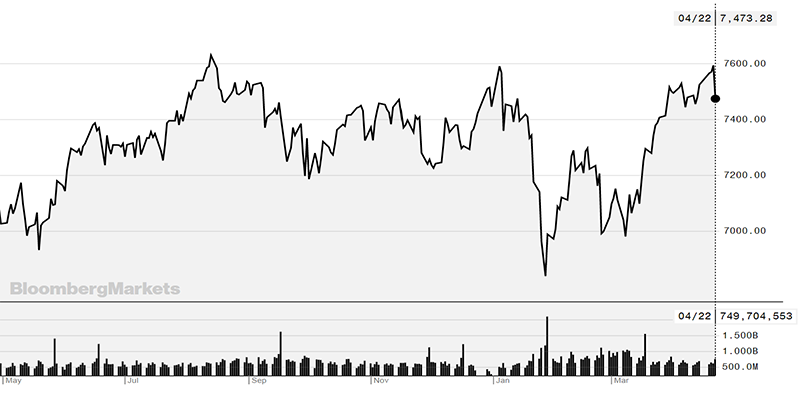
Source: Bloomberg Markets
The story internationally is quite different. Usually it’s international shares, and in particular US shares that lead the way when it comes to market recoveries, but not this time. As shown in the chart below the S&P500 Index, which is the main index for measuring the performance of US markets is still well below the peak which occurred back in December.
US S&P 500 Index – 1 year movement to 24 April 2022
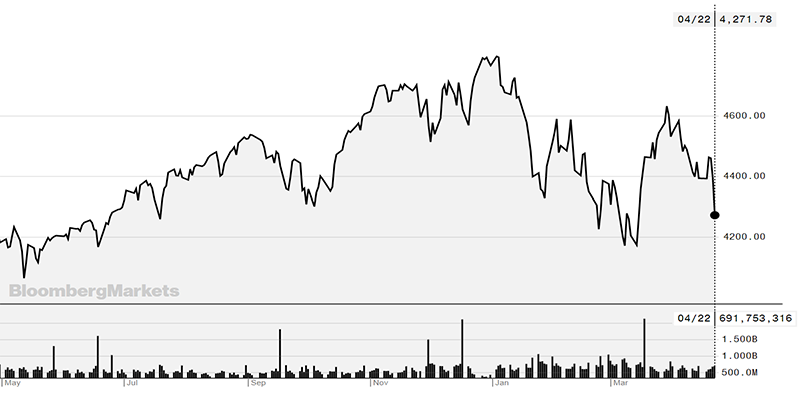
Source: Bloomberg Markets
The question therefore is why this disparity between the Australian & US markets exists. The reason is mainly to do with the US market boom in 2020/21 being driven by high growth companies such as Tesla, Netflix, Apple, Amazon and other, mainly tech, companies. The key financial feature of all these companies have revenue in future years being significantly higher than they are now.
But once we enter 2022, it has become increasingly clear that we’re in a rising interest rate environment. In the mathematics of Discounted Cash Flow analysis (the tool that fund managers use to work out what a company is worth in today’s dollars, if you increase the interest rate in the DCF calculation, future revenues are more heavily discounted than current revenues. Therefore, the valuations of growth companies that were market favourites only 6 months ago are now significantly, lower and their share price has fallen as a result.
The point of the above two market examples is to highlight the value of diversification. It’s important to hold both Australian Equities and International Equities because the latter doesn’t always outperform the former. And, within asset classes it’s important to have some more value/quality driven fund managers in addition to the growth managers, because growth doesn’t always outperform.
Another example of the value of diversification is the performance of the Infrastructure class that Harvest has gradually been increasing your exposure to (Important Note: some corporate super platforms don’t provide access to infrastructure investments). We couldn’t find a usable chart to demonstrate our claim, but the S&P Global infrastructure Index has returned 11.3% over the past 12 months with significantly less volatility than equities. Furthermore, infrastructure assets will be a terrific hedge against inflation, should it take hold, because most infrastructure assets have CPI increases built into their revenue agreements (eg. The annual increase in the toll on the M2 motorway).
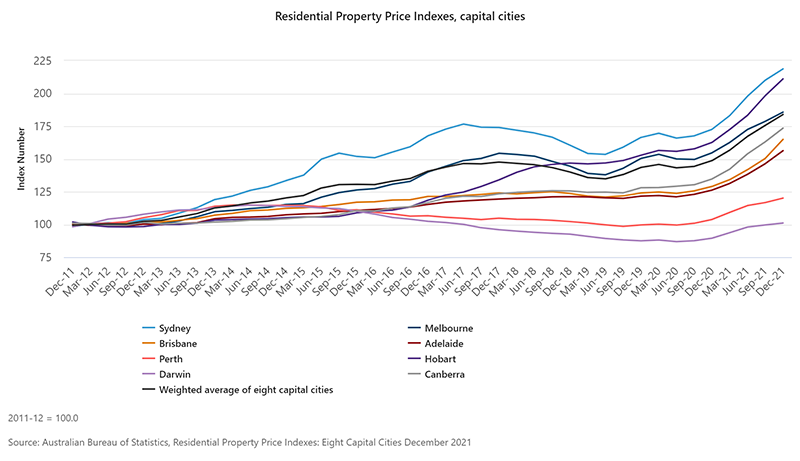
A final comment on house prices. It has been widely commented on that house prices are likely to fall when interest rates rise. Current observations are that auction clearance rates are falling and the rate of price increases is definitely slowing. However, as shown in the ABS chart below, there is no sign of house prices levelling off let alone falling just yet. First home buyers, stay calm for the time being, your chance will come!